
Toronto Cap Rates
How they're derived and their impact on value

Despite the headline-grabbing potential of CMHC’s MLI Select program—which theoretically allows leverage up to 95%—the practical reality in Toronto’s purpose-built rental sector is quite different. Due to lender income requirements and today’s operating fundamentals, the true maximum leverage for most new projects lands closer to 55–57%. This constraint, combined with a careful look at the cost of capital and long-term growth expectations, leads to a justified cap rate for residential purpose-built rental properties of around 4.5%.
This figure is not the result of market inertia or convention, but a grounded outcome of current financing and risk conditions.
The Limits Behind Leverage Headlines
While insured mortgage rates remain competitive—about 3.9% for 40-year amortizations—lenders focus intently on a project’s ability to service debt. With net operating income needing to cover debt payments by at least 1.1 times, and operating expenses typically consuming 30% of gross income, the maximum supportable loan is much lower than policy ceilings might suggest. This income-based constraint is what truly governs leverage in today’s market.
Adjusting for the Realities of Private Ownership
On the equity side, the story is more nuanced. Public Ontario REITs provide a useful benchmark, having delivered equity returns in the 9–10% range in recent years. However, private owners face a very different risk profile. Without the benefits of diversification, liquidity, or access to public capital, private investors must demand a higher return. By adjusting the beta to reflect the realities of private ownership, the cost of equity for these properties is best estimated in the low-to-mid teens. This approach is widely used by institutional investors and better captures the risk premium required for private real estate holdings.
Weighing the Pieces: Blending Debt and Equity
Blending these two sources of capital at the leverage actually achievable under today’s DSCR constraints yields a weighted average cost of capital (WACC) in the high 7% range. This is the true “required return” that both debt and equity providers expect from a purpose-built rental property in Toronto.
Looking Beyond Today’s Cash Flows
A property’s value is not just about today’s cash flows, but also about the growth those cash flows can achieve over time. For Toronto multifamily, a 3% annual growth in net operating income is a reasonable long-term assumption, supported by both historical rent trends and the city’s ongoing demand fundamentals.
Bringing It All Together
When we bring these elements together, the cap rate emerges as the difference between the required return and expected growth. With a WACC of roughly 7.5% and a 3% growth rate, the implied cap rate for Toronto PBR is about 4.5%.
It’s important to recognize that this figure is not static. The forward curves for Bankers’ Acceptances (BAX) and Overnight Index Swaps (OIS) suggest that interest rates may shift over the next several years. Should borrowing costs decline, the WACC and thus the cap rate could compress further; if rates rise, the cap rate will need to adjust upward to maintain investor and lender confidence.
A Look Back: How 2022 Differs from Today
To understand how market conditions have evolved, it’s useful to compare the makeup of the WACC and implied growth rate (“g”) at the 2022 peak versus today:
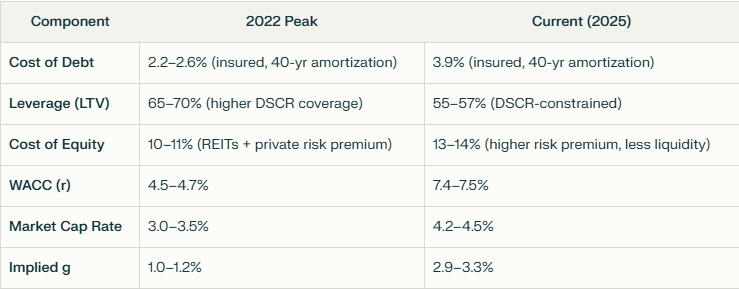
At the 2022 peak, exceptionally cheap debt and aggressive leverage drove down the WACC, while cap rates were compressed by investor demand and ultra-low interest rates. The implied perpetual NOI growth rate was relatively low (1.0–1.2%), reflecting a market more focused on capital appreciation and short-term rent spikes than on sustainable long-term growth.
Today, higher interest rates and tighter lending standards have pushed the WACC up, and cap rates have expanded accordingly. The implied growth rate is now much higher (around 3%), aligning more closely with long-term rent growth expectations for Toronto purpose-built rentals.
Quantifying the Impact: Cap Rates, Rents, and Value
To understand why values have dropped from the peak—even as rents have risen—it’s helpful to walk through the math using a clear percentage-based example.
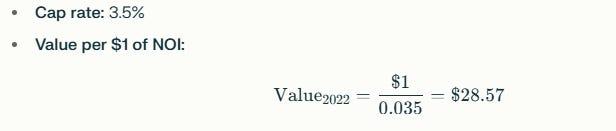
Let’s use $1 of NOI for easy comparison.
At the 2022 Peak
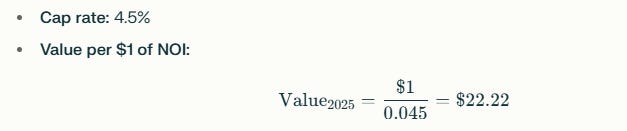
Today
Change in Value (if NOI is unchanged):

So, a cap rate increase from 3.5% to 4.5% reduces value by about 22% if rents (NOI) are flat.
What if NOI (Rents) Increased by 10%?

Change in Value (vs. 2022 peak):

So, even with a 10% rent (NOI) increase, property value is still down 14.4% from the peak.
Summary Table
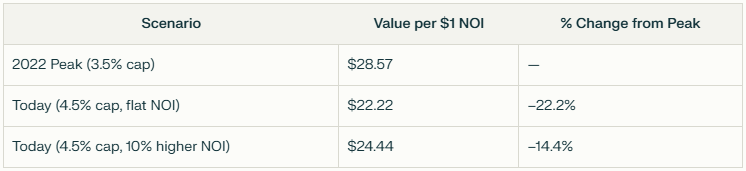
Key takeaway:
Even with a 10% increase in rents, the rise in cap rates from 3.5% to 4.5% has more than offset the gains in NOI, resulting in a significant decline in property values. This dynamic explains why Toronto multifamily values are lower today than at the market’s peak, despite healthy rent growth.
A Framework for Today’s Market
While policy headlines may suggest ultra-high leverage is available, the real constraints are rooted in income and risk. By grounding our view of cap rates in actual financing conditions, risk-adjusted equity returns, and reasonable growth expectations, we arrive at a cap rate of about 4.5% as a defensible benchmark for current Toronto purpose-built rentals.
This approach ensures underwriting is rigorous and responsive to today’s realities, offering a more reliable foundation for investment decisions as the market continues to evolve.